

Public sector pay is the largest and most persistent pressure on NI's public finances. Each year, negotiations over pay awards for nurses, teachers, civil servants, police officers and other public servants raise important questions about fairness, recruitment, retention and maintaining parity with the rest of the UK.
Yet for something so large, remarkably little is known about what actually drives the relative size of NI’s public sector pay bill. Our recent paper suggests that pressures are driven less by relative pay levels for particular types of workers and more by the interaction between funding arrangements, workforce size and service delivery structures. The paper was presented by Dr Esmond Birnie at our annual conference on 25 September, where it benefited from discussion with stakeholders. We remain keen to receive further feedback, evidence and constructive challenge as this work develops.
The Recurring Challenge of Public Sector Pay
Public sector pay is the single largest element of day-to-day resource spending funded by the Executive, accounting for around £10 billion each year or 60 per cent of the total. Pay awards are baked into employees’ remuneration and create permanent costs that mean pressures can build over time if funding does not keep pace.
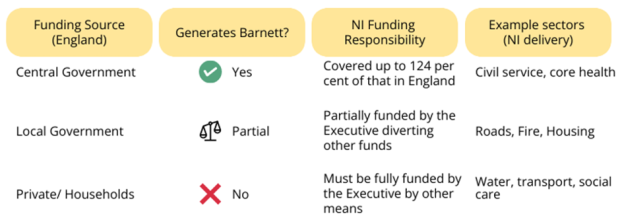
When public sector pay awards are made in England, they generate additional funding (Barnett consequentials) for the Executive only where they increase UK Government spending on services that are also devolved in NI. Not all Executive-funded services have direct equivalents in England, so some generate limited or no Barnett consequentials. Where funding is generated, the key question is whether it is sufficient to cover the cost of delivering equivalent settlements in NI. Where funding is not generated, or where no additional funding arises, the Executive must meet the cost from within its existing budget, creating difficult trade-offs between pay, workforce numbers and other spending priorities.
Understanding Pay Parity
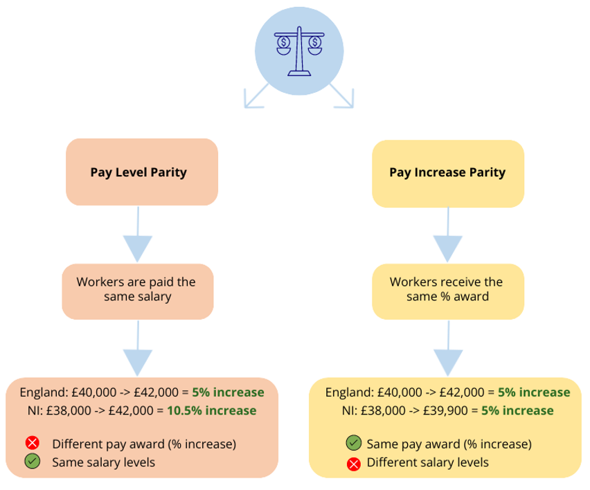
A key distinction in public sector pay debates is between pay level parity and pay increase parity, concepts that are often treated as interchangeable but have very different fiscal implications.
- Pay Level Parity means workers in NI receive the same salaries as comparable workers elsewhere in the UK.
- Pay Increase Parity means workers receive the same annual percentage increase, even when salary levels differ.
As the figure below illustrates, understanding the distinction between pay level parity and pay increase parity is important when considering the affordability of public sector pay. The key question is whether the funding generated by pay awards in England is sufficient to support the Executive's chosen approach to maintaining pay settlements.
Figure 1 – The distinction between pay level parity and pay increase parity
A Structural Affordability Gap
The Council's initial analysis suggests that the public sector pay bill for comparable services in NI is around 35 to 45 per cent higher per head than in England, while funding is only around 24 per cent higher. This indicates a structural funding challenge, where the cost of maintaining pay parity grows faster than the funding generated through the Barnett Formula.
The 2024-25 health pay settlement provides a practical illustration of this challenge. The estimated cost of implementing the same health pay awards in NI as in the rest of the UK was around £320 million, compared with Barnett consequentials of approximately £238 million, leaving a funding gap of around £82 million. As the chart below illustrates, this gap is not a one-off pressure. Because pay awards create permanent costs that carry forward into future years, the cumulative gap can continue to grow unless additional funding is identified.
Figure 2 – The funding gap between Health pay awards and Barnett funding
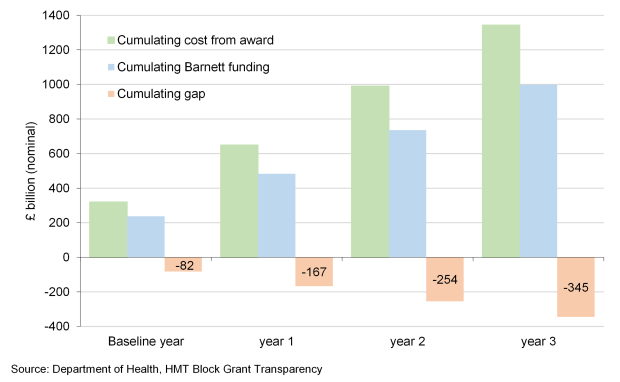
The chart highlights how a one-off pay award can generate a recurring funding pressure, with the cumulative cost growing faster than the associated Barnett funding over time.
The discussion paper identifies four potential explanations for this gap:
- Higher numbers of public sector staff.
- Different service delivery arrangements.
- Higher pay levels.
- Differences in workforce composition and grading.
Workforce Size: The Biggest Driver
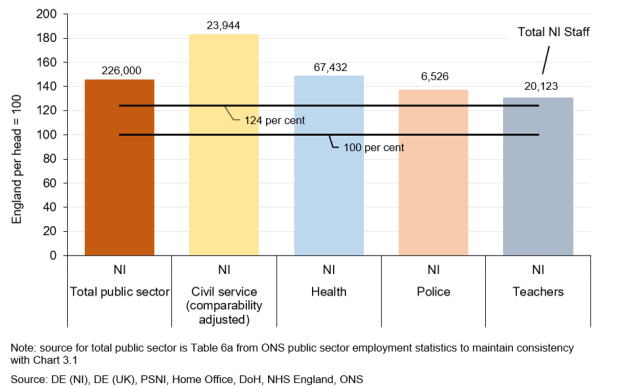
Workforce size appears to be the most significant driver of public sector pay pressures in NI. On a population-adjusted basis, NI employs around 46 per cent more public sector workers than England. This means that a given percentage pay award applies to a much larger workforce, increasing its overall fiscal cost. This pattern is evident across major services, including health, education, policing and the civil service. While some of the difference may reflect decisions about the scale and delivery of public services, a larger workforce inevitably means a larger pay bill and a higher cost of maintaining pay parity.
Figure 3 - NI public sector workforce per head compared to England
Service Delivery Structures Matter Too
A second factor is how public services are organised and delivered. Several services funded through the Executive's budget, including water, transport, housing and aspects of social care, are delivered by local authorities, public corporations or private providers in England, but remain within the public sector in NI. This creates additional pay pressures because pay awards may generate little or no Barnett funding, despite the Executive remaining responsible for the costs. Staffing costs in these non-equivalent services exceed £1 billion a year, suggesting that differences in service delivery arrangements are another important source of pressure on public sector pay budgets.
Figure 4 – How service funding arrangements in England determine Barnett Consequentials for NI
Are Higher Pay Levels the Problem?
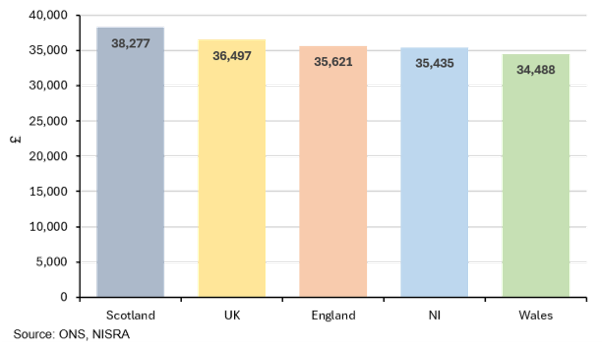
In short, no. Median public sector earnings are slightly lower than in England overall, although earnings are higher in some occupations (including where overtime and allowances make up a larger share of remuneration). For many of the largest workforce groups, including teachers, nurses and civil servants, pay is broadly similar to, or lower than, that of their counterparts elsewhere in the UK.
Figure 5 - Median annual public sector earnings across different UK regions, 2020-2025
The Impact of Workforce Composition
Another potential explanation is workforce composition. A workforce with a higher proportion of senior or specialist staff will, all else equal, have a higher pay bill. However, the available evidence suggests that this is not a major driver of public sector pay affordability pressures overall. While some sectors, particularly parts of the health service, have a greater concentration of specialist roles (i.e. higher grade and higher pay), this is not the norm across the entire public sector. For example, the NI Civil Service has a relatively larger share of junior grades than the UK Civil Service, with 62.4 per cent of staff in junior grades compared with 51.3 per cent across the UK Civil Service.
Conclusion
The Council's initial analysis points to a clear conclusion: NI's public sector pay pressures are primarily structural rather than temporary.
For a pay award in England to be affordable in NI, two conditions must hold.
First, it must generate a Barnett consequential. Yet some services funded by the Executive, including water, housing and transport, are organised and funded differently in England and therefore generate limited or no Barnett consequentials.
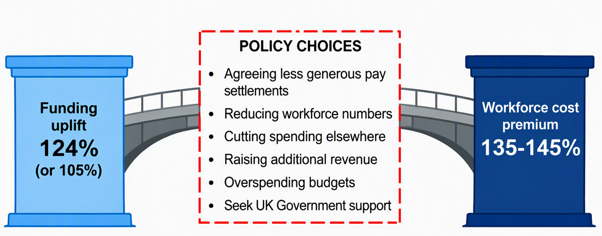
Second, where a consequential does arise, it must be sufficient to cover the cost of maintaining an equivalent pay settlement in NI. While NI currently receives around 24 per cent more funding per head than England for comparable services (which could fall to 105 per cent if NI were assessed as receiving funding above its relative level of need under the Fiscal Framework's transitional arrangements), our analysis suggests that the cost of delivering comparable public services is around 135 to 145 per cent of the English level.
Consequently, the cost of maintaining pay parity can exceed the funding generated by UK Government pay awards. Of the four potential explanations examined, workforce size appears to be the most significant driver of this gap, with service delivery structures also playing an important role. By contrast, pay levels and workforce composition do not appear to drive the aggregate picture. Average public sector pay in NI is generally comparable to, or lower than, elsewhere in the UK, partly reflecting a lower proportion of staff in the most senior grades. The challenge therefore appears to stem more from the number of people employed and the way services are organised and funded than from what staff are paid. Where gaps emerge, they must ultimately be bridged through policy choices on workforce size, service delivery, spending priorities, additional revenue or UK Government support.
Figure 6 – Policy choices to bridge the affordability gap
This raises important questions for the Executive:
- Can current funding arrangements support the size and shape of NI's public sector?
- What are the trade-offs of prioritising pay over other spending?
Do the benefits of maintaining pay parity justify the fiscal cost?
- How should public sector pay fit within wider workforce and fiscal planning more strategically?
These findings should be regarded as an initial contribution to the debate rather than a definitive conclusion. Further work is planned to deepen understanding of the factors driving cost differences across jurisdictions.
The Council intends to develop this analysis further and welcomes views, evidence and constructive challenge from stakeholders and interested parties. Those wishing to contribute to this work are invited to email us at info@nifiscalcouncil.org